|
|
||
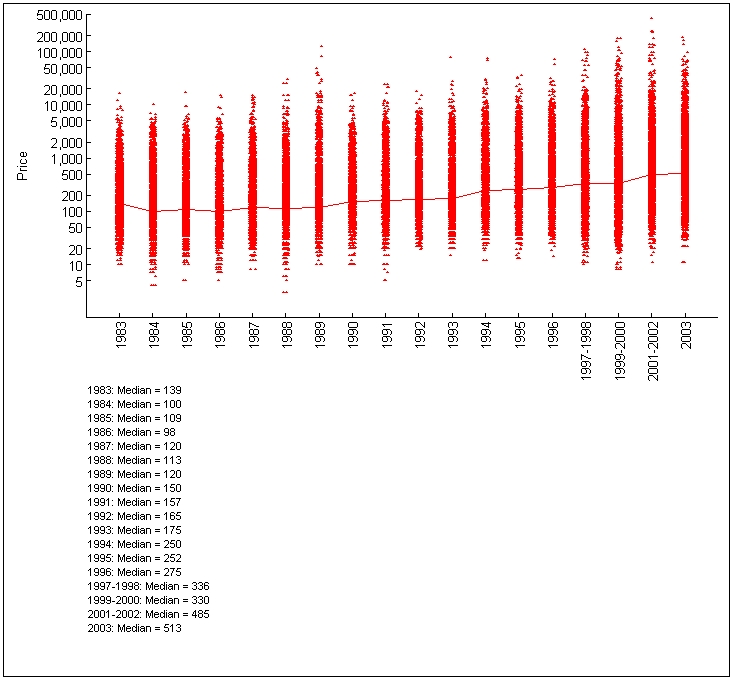
The following graph plots the prices of all items listed in the Antique Map Price Record over its 20 year history. Because of the large number of points (86,683), the individual dots form a blur through most of the price range in each year, with just the upper and lower extreme values standing out as individual points. The line drawn between the years shows the median values, which are also listed in the table below. The overall median, across all 20 years is $185. For a simpler view of just the median values, and some comments on what might be contributing to the trends shown here, see the bargraph of median prices.
Because of the extreme range and skewed distribution of the prices (from $3 to $425,000), the Y-axis is plotted on a logarithmic scale.
|
Home |
Information |
Search |
Register |
Contact Us |
Site Map
Americana Exchange, Inc. © 1999 - 2024 Americana Exchange, Inc.. All rights reserved.
OldMaps.com, the OldMaps.com logo and |