|
|
||
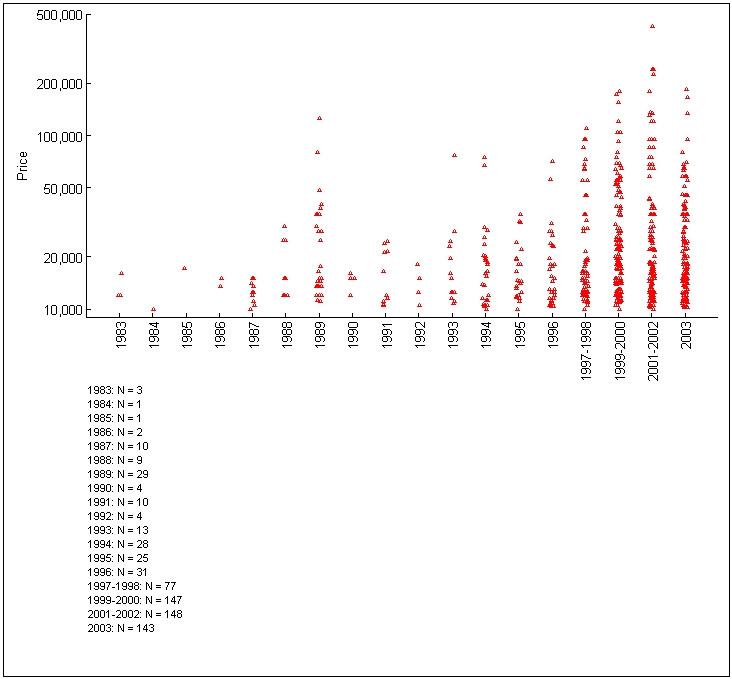
The following graph plots the prices of all items listed in the Antique Map Price Record where the price was at least $10,000. Such items barely appeared at all in the first 4 volumes. There was a minor flurry of high-priced items in the 1989 volume, and then starting in 1994 the number of such items increased noticeably. As with the other graphs, it is hard to feel confident about what this graph actually reflects. It may partly reflect a tendency on the part of the editors in recent years to include more atlases and globes than in earlier years. It probably also reflects, in part, a more active public market (listings in published catalogues) in rarer items. And it undoubtedly reflects, to some degree, simple inflation.
Note that this graph is plotted on a logarithmic scale, due to the wide range and skewed distribution of prices plotted. Even restricting the plot to items listed at $10,000 and above, the graph plots items over a more than 40-fold range, from $10,000 to $425,000.
|
Home |
Information |
Search |
Register |
Contact Us |
Site Map
Americana Exchange, Inc. © 1999 - 2024 Americana Exchange, Inc.. All rights reserved.
OldMaps.com, the OldMaps.com logo and |